Home / view / Achievement Report
Achievement Report
Reports of Annual workload performed in Forensic Science Laboratory
Since its inception, Mizoram FSL has examined large number of various cases and executed other important activities.
The following table highlights the performance of FSL Mizoram during calendar year 2000 to 2023.
Year | Cases Examined | Exhibits Examined | Crime Scene attended | Court summoned |
2000 | 18 | 24 | 0 | - |
2001 | 69 | 287 | 9 | - |
2002 | 109 | 168 | 18 | 1 |
2003 | 180 | 217 | 8 | 0 |
2004 | 180 | 1108 | 24 | 3 |
2005 | 239 | 3705 | 33 | 5 |
2006 | 223 | 7253 | 58 | 26 |
2007 | 272 | 6253 | 73 | 29 |
2008 | 145 | 918 | 69 | 48 |
2009 | 236 | 5094 | 100 | 54 |
2010 | 361 | 5976 | 192 | 24 |
2011 | 339 | 3706 | 111 | 53 |
2012 | 739 | 5153 | 102 | 110 |
2013 | 1152 | 6010 | 121 | 307 |
2014 | 1154 | 18614 | 121 | 383 |
2015 | 1060 | 5256 | 110 | 558 |
2016 | 833 | 11353 | 124 | 163 |
2017 | 697 | 8934 | 75 | 248 |
2018 | 696 | 8396 | 83 | 206 |
| 2019 | 916 | 12399 | 65 | 306 |
| 2020 | 822 | 6026 | 53 | 160 |
| 2021 | 890 | 6885 | 51 | 151 |
| 2022 | 1172 | 25711 | 86 | 221 |
| 2023 | 1413 | 15755 | 96 | 303 |
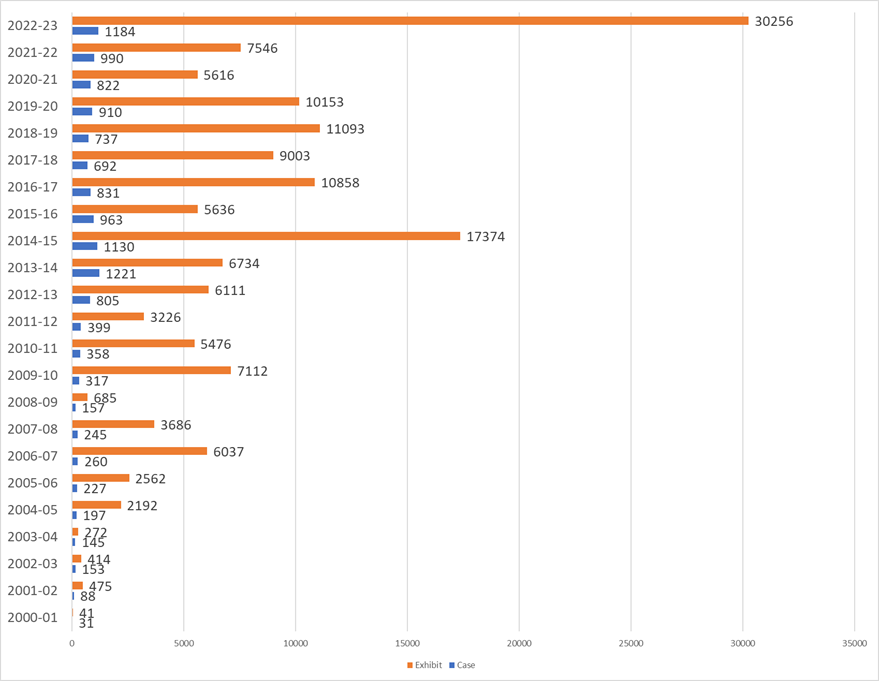
Graphical representation of number of cases/exhibits examined during the year 2000 -‘01 to 2022 -‘23.
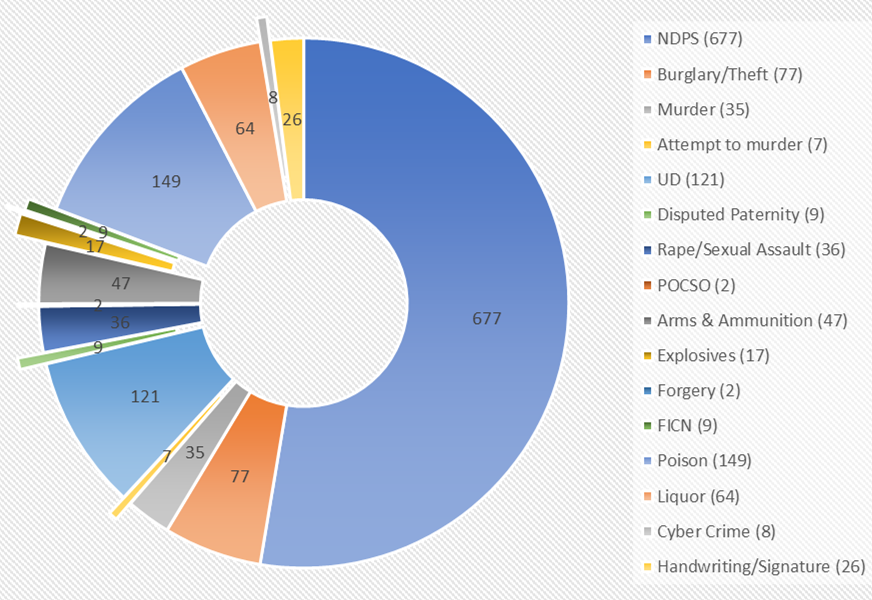
Graphical representation of types of cases examined during the year 2022-2023
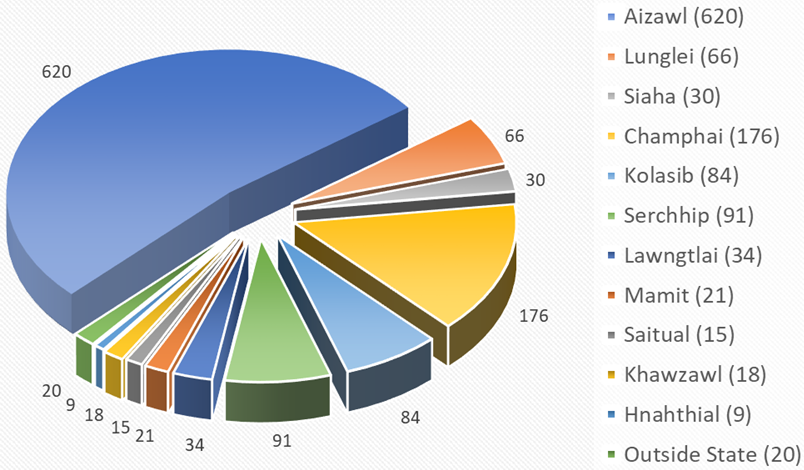
Graphical representation of number of cases examined from different districts during the year 2022-‘23.
| Workload during the year 2024 | Fingerprint database | |
|---|---|---|
(upto 31st October, 2024) | (in AFIS) : 5982 Convicted: 3373 Arrested: 2609 NAFIS: 7853 | |
| Cases Examined | 1061 | |
| Exhibits Examined | 8282 | |
| Crime Scene visit | 70 | |
| Court Summoned | 828 | |
Page updated on 7th November, 2024